Recently I wrote an icinga cluster check which can currently check whether a service runs on atleast on one of two servers.
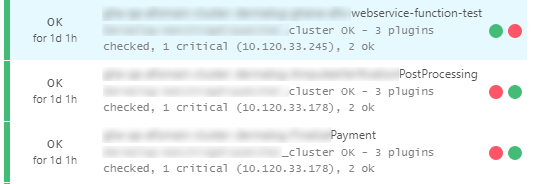
A teaser of the results:
Looking at the available options
This post assumes some basic knowledge about icinga2 and icingaweb2, like the utilization of check_nrpe.
The aim of this post to put the output of cluster-host1:serviceA and cluster-host2:serviceA into one service output. This cluster-service should only show an error if serviceA is down on both cluster-hosts. If we implement the service-checks the standard way and many services on cluster-host1 are down our monitoring is full of critical warnings while there is no actual problem. This can be solved by acknowledging all the checks, but this is just not right. It is the quick-and-dirty solution. What is needed is to create a proper cluster-check!
To do this there are multiple options available:
- check_multi
- check_cluster
- icinga dependencies
- icinga business process addon
Investigating these options further I ended up chosing check_multi. Notes on the alternatives and why they didn't make it:
- check_cluster
- https://github.com/monitoring-plugins/monitoring-plugins/issues/1453#issuecomment-265238322 dnsmichi created a tutorial on check_cluster over here, at the end he however states: “Although check_cluster might be reasonable to call, I'd just go for writing functions and evaluating the state over there. We'll probably find a way to prevent the call to check_dummy at some point, for now it is up to you to choose ;-)”
- https://stackoverflow.com/questions/33279329/icinga2-check-cluster-plugin-and-its-implementation-in-2-3 dnsmichi states the following here: “You should consider dropping the check_cluster plugin and use a more generic way to calculate states. Be it using business processes or check_multi or - a function to calculate the clusterstate in icinga2's “magic” language.”
- all in all judging from these suggestions by icinga-god
dnsmichicheck_cluster just seems like a bad option.
- icinga dependencies
- dependencies enable such relations: if host down, then dont notify / check on child service. What we want from a cluster checks looks kind of like this though: if hostA:service down and hostB:service down then alert. This cannot really be done with dependencies as far as I understood the mechanism.
- https://www.icinga.com/docs/icinga2/latest/doc/03-monitoring-basics/#dependencies
- icinga business process addon
- check_cluster worked before i tried this, might be good?
- https://www.netways.de/produkte/icinga/addons/business_process_addon/
Special qualities of this cluster check and the command file
For the cluster check I had the following two requirements which complicated the setup, but it was worth it:
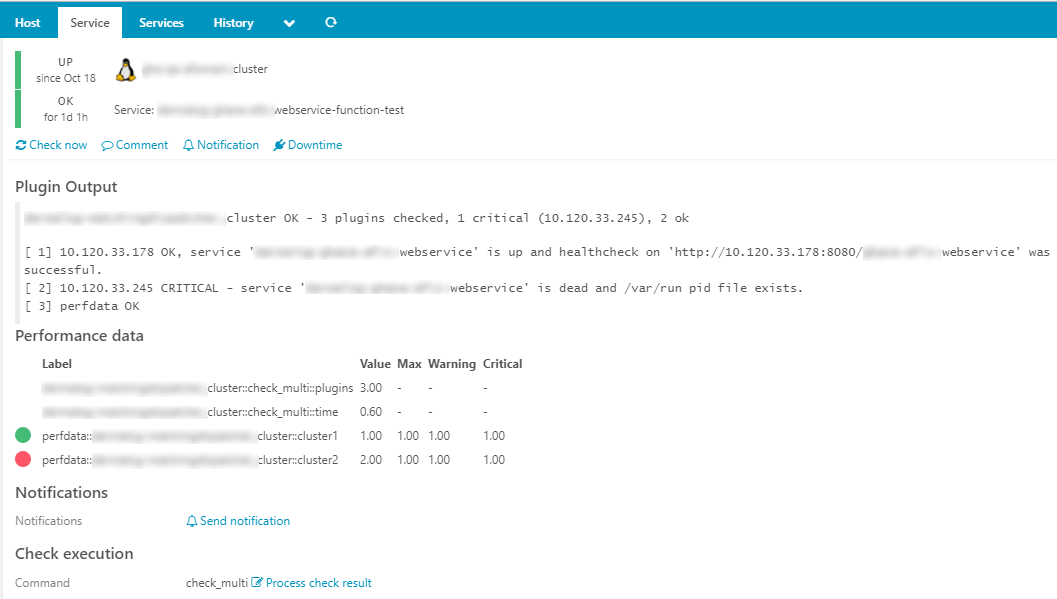
- display a pie chart for convenience in icingaweb2
-
requires the perfdata to contain “minValue”, “maxValue” and “value”! From here:
public function isVisualizable() { return isset($this->minValue) && isset($this->maxValue) && isset($this->value); } -
for this the result of the service checks have to be interpreted. they are really just text and an exit code in this case.
-
- make it so the pie charts already indicate which host is down / up
- usually icingaweb2 sorts the pie-charts. if this is turned off we can judge which host is down without even looking at the exact service output
- /usr/share/icingaweb2/modules/monitoring/application/views/helpers/Perfdata.php
The actual files and setup
The files contain two components:
- check_cluster host / service / check_command definition
- the .cmd file which contains all the actual magic (configuration for check_multi)
object Host "project-host1" {
    import "generic-linux"

    address = "10.120.33.178"
    groups += [ "linux", "project-hosts" ]
}

object Host "project-host2" {
    import "generic-linux"

    address = "10.120.33.245"
    groups += [ "linux", "project-hosts" ]
}

object Host "project-cluster" {
    import "generic-linux"

    check_command = "dummy"
    vars.dummy_state = 0
    vars.dummy_text = "Host can not be pinged, should be up, hopefully..."

    vars.cluster1 = "10.120.33.178"
    vars.cluster2 = "10.120.33.245"

    groups += [ "linux", "project-hosts" ]
}
Notice how a dummy host is created to execute the cluster_checks. Assigning them to either “project-host1” or “project-host2” would not be quite right. However like this we introduced a dummy host which doesn't actually exist, but I prefer this solution.
object CheckCommand "check_multi" {
        command = [ PluginDir + "/check_multi",
        "--libexec", "/usr/lib64/nagios/plugins",
        "-f", "$multi_command_file$",
        "-s", "CHECK_COMMAND=$multi_command$",
        "-s", "CLUSTER1=$cluster1$",
        "-s", "CLUSTER2=$cluster2$",
        "-c", "$multi_critical$",
        "-w", "$multi_warning$",
        "-n", "$multi_name$",
        "-r", "$report_style$"
        ]
}

template Service "generic-cluster-service" {
  import "generic-service"

  vars.multi_command = "webservice"
  vars.multi_warning = "COUNT(CRITICAL)>1"
  vars.multi_critical = "COUNT(CRITICAL)>1"
  vars.report_style = "1+4+8"
  vars.multi_name = "webservice"
  vars.multi_verbose = "2"

  check_command = "check_multi"
  vars.multi_command_file = "/usr/lib64/nagios/plugins/distributed_two.cmd"
}

apply Service "webservice" {
  import "generic-cluster-service"
  vars.multi_command =  "webservice"
  assign where host.name == "project-cluster"
}
Notice how we can define the cluster-ips in the host-definition and other variables like the nrpe-command to be executed in the service definition, while they can all be pulled together equally in the CheckCommand. I like this about icinga2.
command [ $CLUSTER1$ ] = set -o pipefail; check_nrpe -H $CLUSTER1$ -t $TIMEOUT$ -c $CHECK_COMMAND$ | tee /tmp/check_multi/$CLUSTER1$_$CHECK_COMMAND$
command [ $CLUSTER2$ ] = set -o pipefail; check_nrpe -H $CLUSTER2$ -t $TIMEOUT$ -c $CHECK_COMMAND$ | tee /tmp/check_multi/$CLUSTER2$_$CHECK_COMMAND$

command [ perfdata::insert_servicename_here_cluster ] = /bin/echo "OK|cluster1=$(if grep -q CRITICAL /tmp/check_multi/$CHECK_COMMAND$_cluster1; then echo '2'; else echo '1'; fi);1;1;0;1 cluster2=$(if grep -q CRITICAL /tmp/check_multi/$CHECK_COMMAND$_cluster2; then echo '2'; else echo '1'; fi);1;1;0;1"
Notes on distributed_two.cmd
- “set -o pipefail;” carries on any exit status even through piping. otherwise the exit-status of check_nrpe gets lost and the checks always return “OK”
- “| tee /tmp/check_multi/” makes it so the output of check_nrpe gets echoed but also written to a text-file, so we can digest it later to create the perfdata which is required for the piecharts to work
- tee saves the file to the standard check_multi tmp directory (check_multi creates this out of the box) and saves them to a file which includes the check_command and the node name. This way there should be no confict between multiple of these checks being executed at the same time
- the last line, the perfdata command is straight forward, but to break it down:
- echo OK|cluster1=$VAR1;1;1;0;1 cluster2=$VAR2;1;1;0;1
- VAR1 = if grep -q CRITICAL /tmp/check_multi/$CHECK_COMMAND$_cluster1; then echo ‘2’; else echo ‘1’; fi
- VAR2 = if grep -q CRITICAL /tmp/check_multi/$CHECK_COMMAND$_cluster2; then echo ‘2’; else echo ‘1’; fi
- echo OK|cluster1=$VAR1;1;1;0;1 cluster2=$VAR2;1;1;0;1
The result and the downsides
I am proud to check clusters this conveniently now!
A cluster check as I had imagined can be done as described. I am happy with this solution, while I know I have cheated the system at some points. These cheats are included in the following downsides:
- Modification of icingaweb2 code, may bite me in the ass when i update
- I create a bunch of files in /tmp/check_multi. This may bite me in the ass in huge setups performance-wise
- The performance data looks as follows if the check returns “critical”: “2;1;1;0;1”. This is a way to create a full red chie part. The value of the check is not actually “2”, but this results in the desired behavior so I think its fine.
- Check_multi counts the performance data as another command, which results in 3 commands in total. This is not actually what I want, I dont want the performance data generation to show up as a seperate command but I couldn't find a way around that.
- I can't display the cluster-checks properly with pnp4nagios. This would be the endgame i think. However I have to remind myself that I am working with a check which doesn't even return performance data on its own, so I think its fine to just have the exit status without a pnp4nagios graph.
- I can only check 2 clusters as of now. This is fine for me but it would be cooler to have the check_multi command be more generic.
- I have to define the IP of cluster1 and cluster2 and two places. Configuring the same information twice is always bad, but in this case its okay for me.